A look at the final interface: The dashboard shows real-time processing, lead concentration metrics, and a detailed breakdown of strategic signals for each prospect.
The Challenge
Most e-commerce teams are reactive - they analyze last month and blast campaigns broadly. This project turns customer analytics into a decision engine:
- Predict which customers will generate revenue in the next 90 days
- Explain the drivers globally and per-customer (SHAP)
- Optimize how to spend a fixed budget for maximum expected uplift (and quantify risk)
The Solution
Pipeline
- Generates a realistic customer + transaction dataset (or uses provided CSVs)
- Builds RFM + behavioral features (recency, frequency, monetary, AOV, tenure, inter-purchase time)
- Trains an XGBoost regressor to predict 90-day revenue
- Produces evaluation artifacts (metrics + SHAP global importance)
App
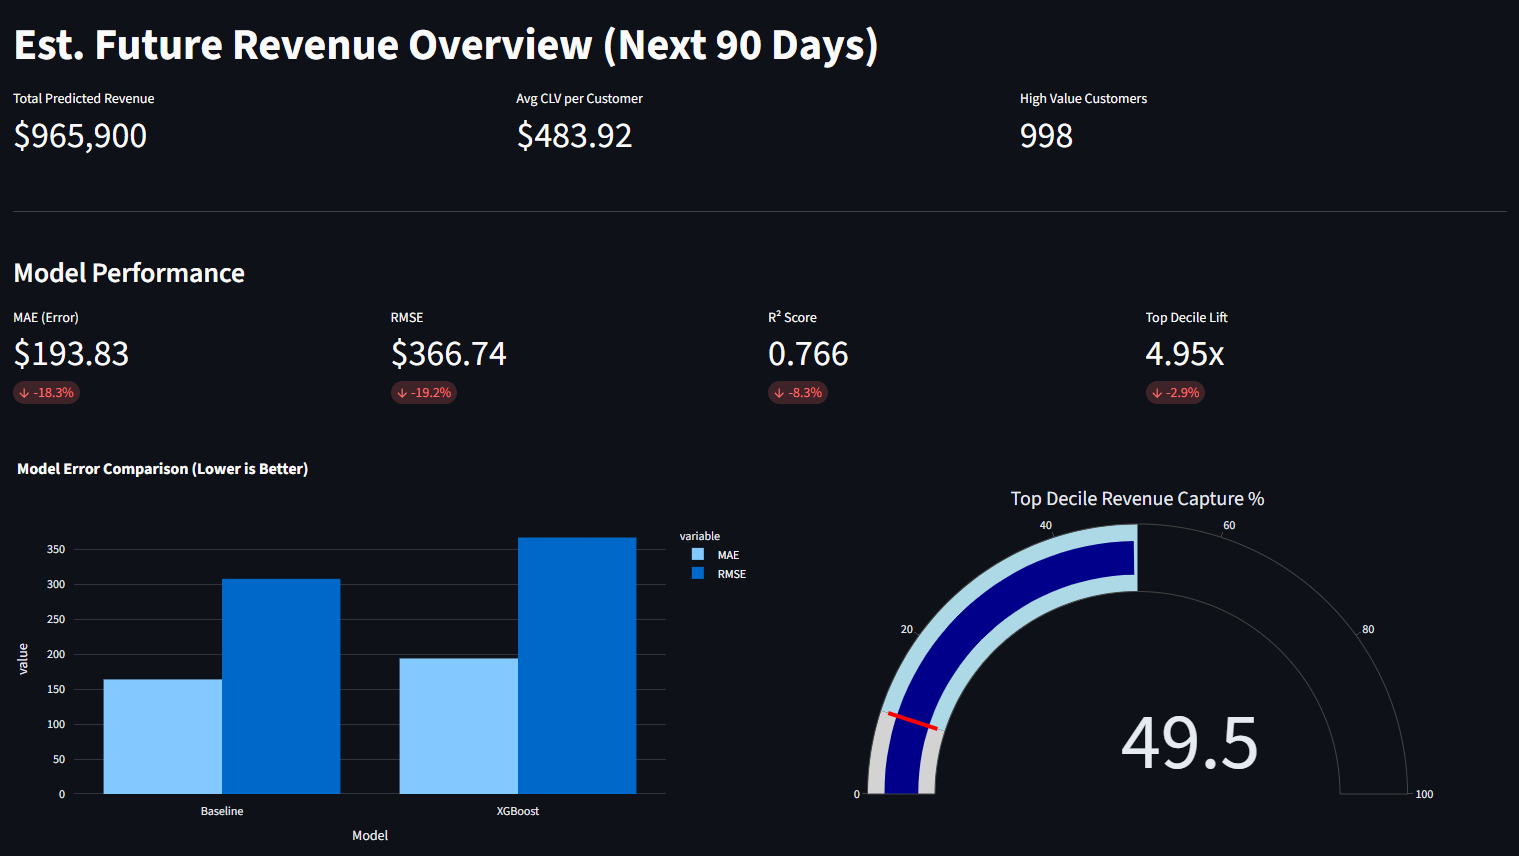
- Executive dashboard (revenue estimate + model metrics)
- Drivers of customer value (global SHAP)
- Customer explorer (local explanation)
- ROI simulator + decision optimization
- Sensitivity analysis + Monte Carlo risk analysis
Key results
- Top-decile lift ~5x: the top 10% predicted customers capture ~50% of future revenue (typical CLV “power law” pattern)
- Strong explainability: business-readable drivers (monetary, AOV, frequency, recency, etc.)
- Prescriptive layer: converts predictions into budget decisions (ROI, efficient frontier, risk)
Dashboard walkthrough
1) Drivers of Customer Value (Global SHAP)
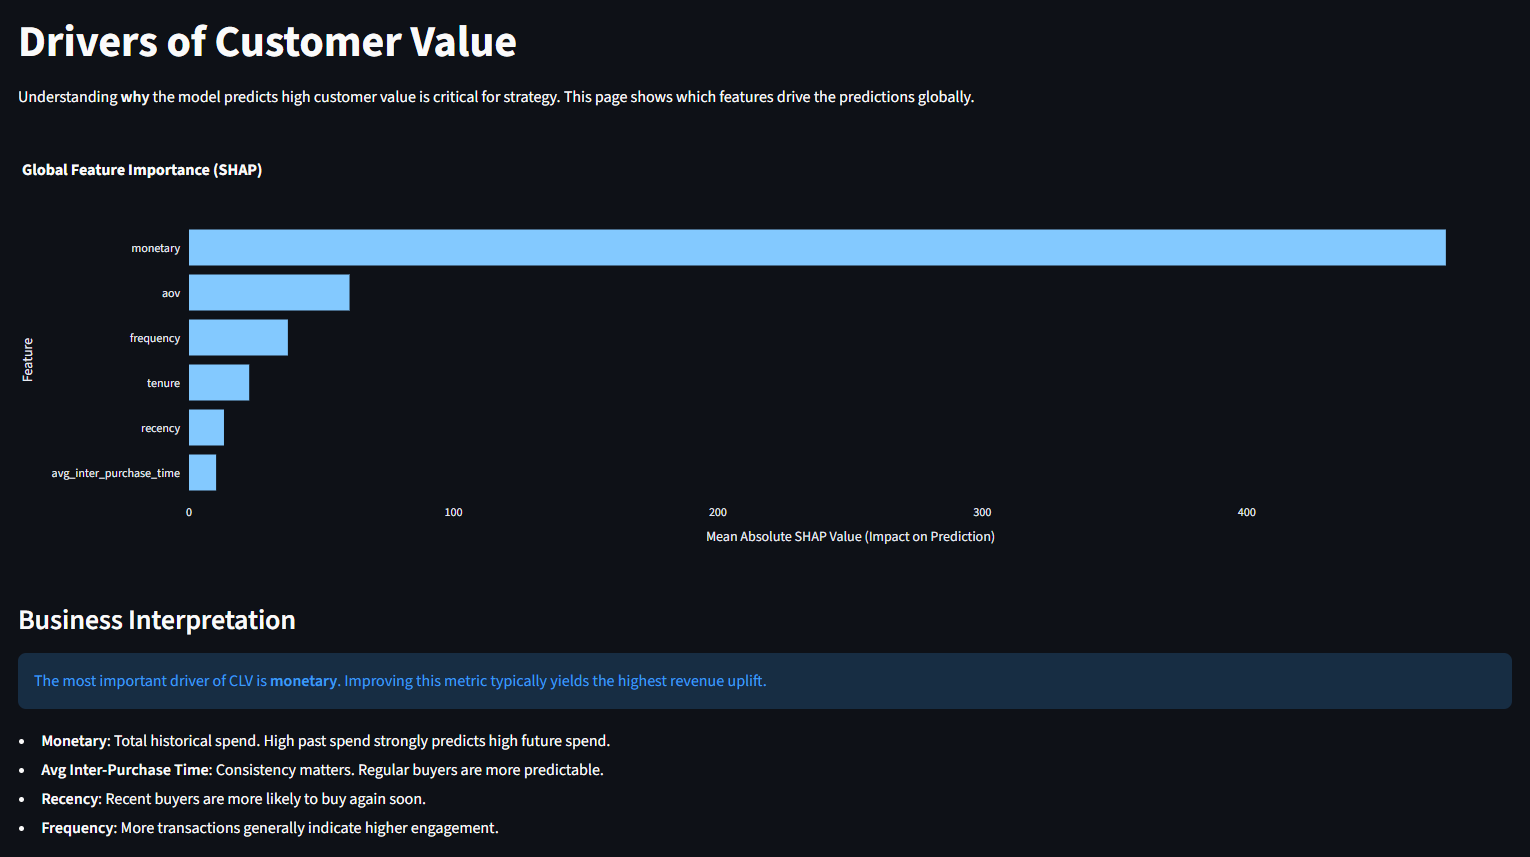
A look at the final interface: The dashboard shows real-time processing, lead concentration metrics, and a detailed breakdown of strategic signals for each prospect.
2) Customer Explorer (Local explanation)
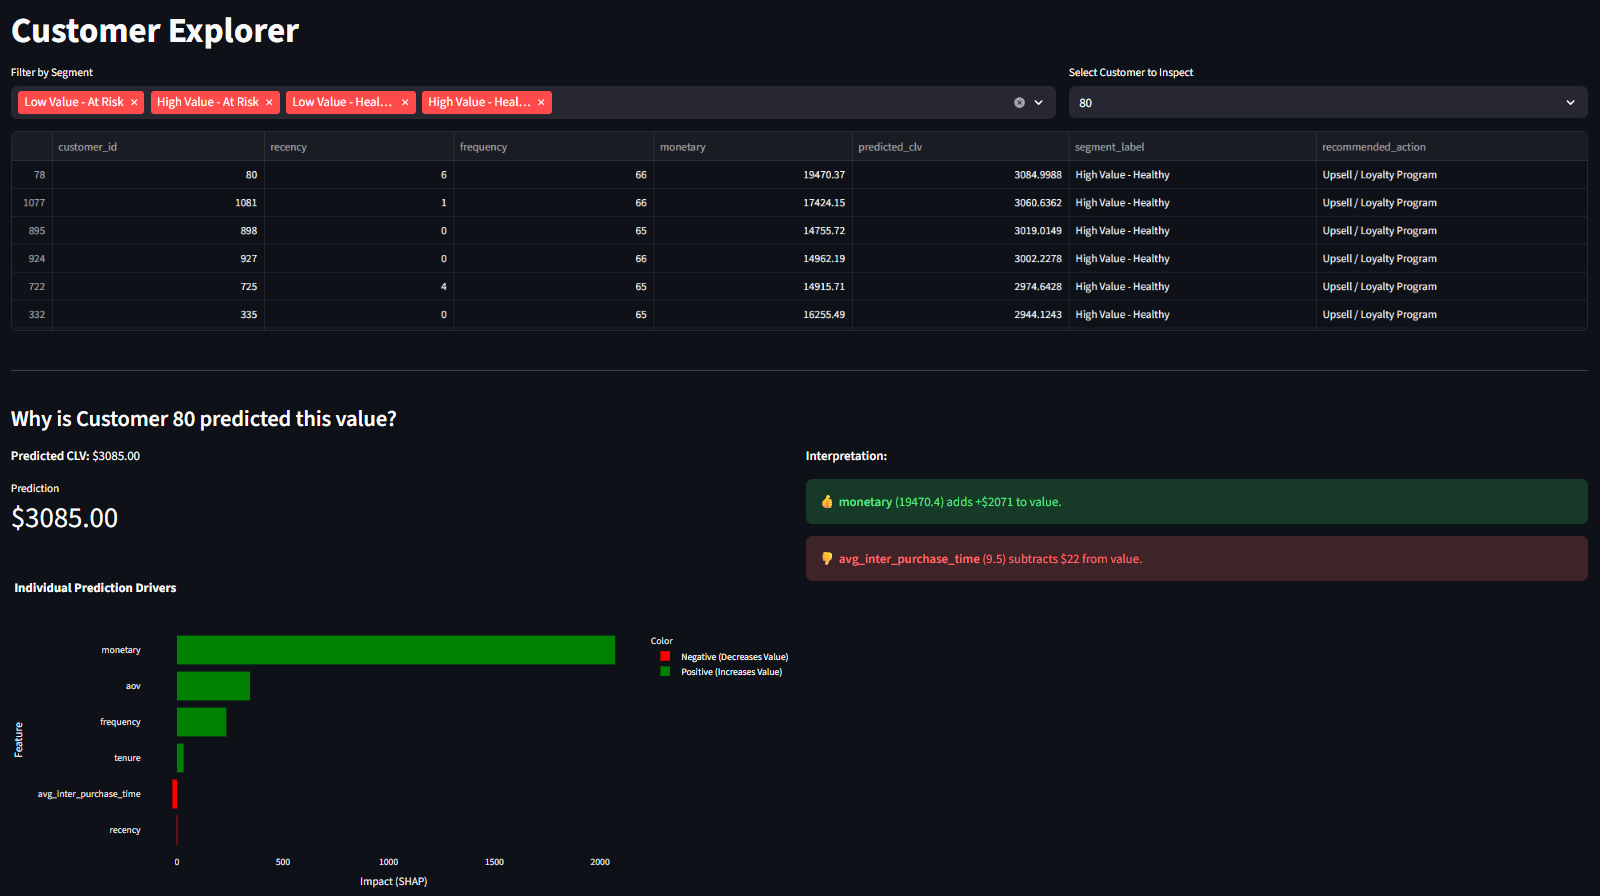
A look at the final interface: The dashboard shows real-time processing, lead concentration metrics, and a detailed breakdown of strategic signals for each prospect.
3) ROI Simulator & Optimization
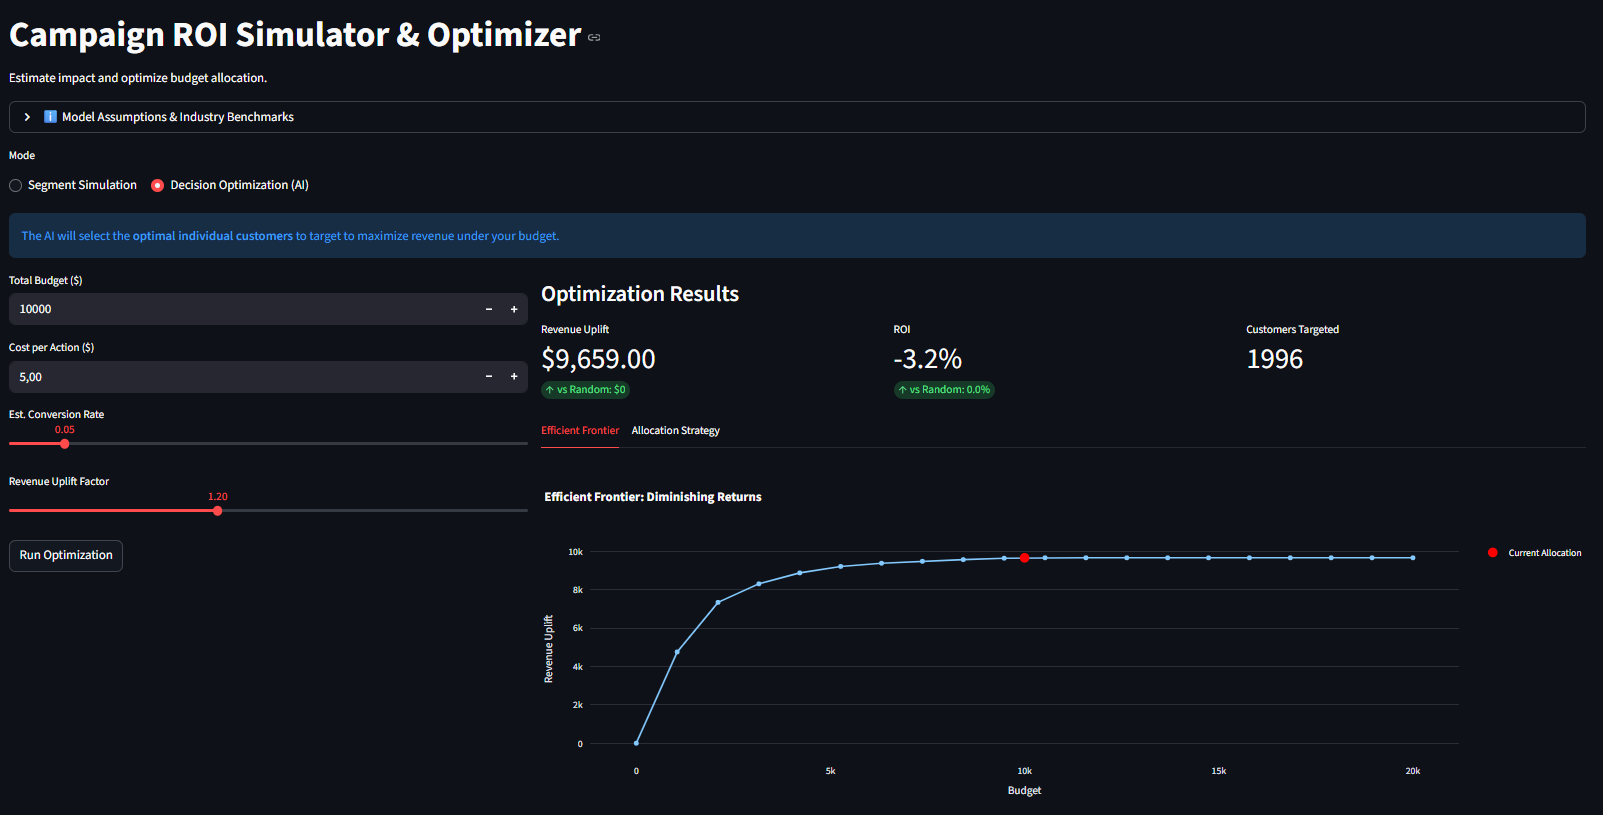
A look at the final interface: The dashboard shows real-time processing, lead concentration metrics, and a detailed breakdown of strategic signals for each prospect.
Notes & Limitations
- The model is predictive (correlation), not causal.
- ROI and uplift are assumption-driven simulations → should be validated with A/B tests / RCTs.
- The optimization is only as good as the uplift + cost assumptions.